Compare Image Analysis Runs
Compare puts two or more image analysis runs into one data table, so treated reads against control in the same rows. You pick the runs, pick the measures they share, and the table arrives with its chart already open.
Building the Comparison
There are four ways in:
- Tick several runs on the Analysis tab and choose Compare on the bulk bar.
- Use Compare in that tab's header. The header button appears once the project holds two runs with results.
- Choose Compare from the ⋯ on a run's row in the list.
- Open the ⋯ menu at the top of a run and choose Compare.
Both menus start the dialog box with that run already picked.
Picking the Runs
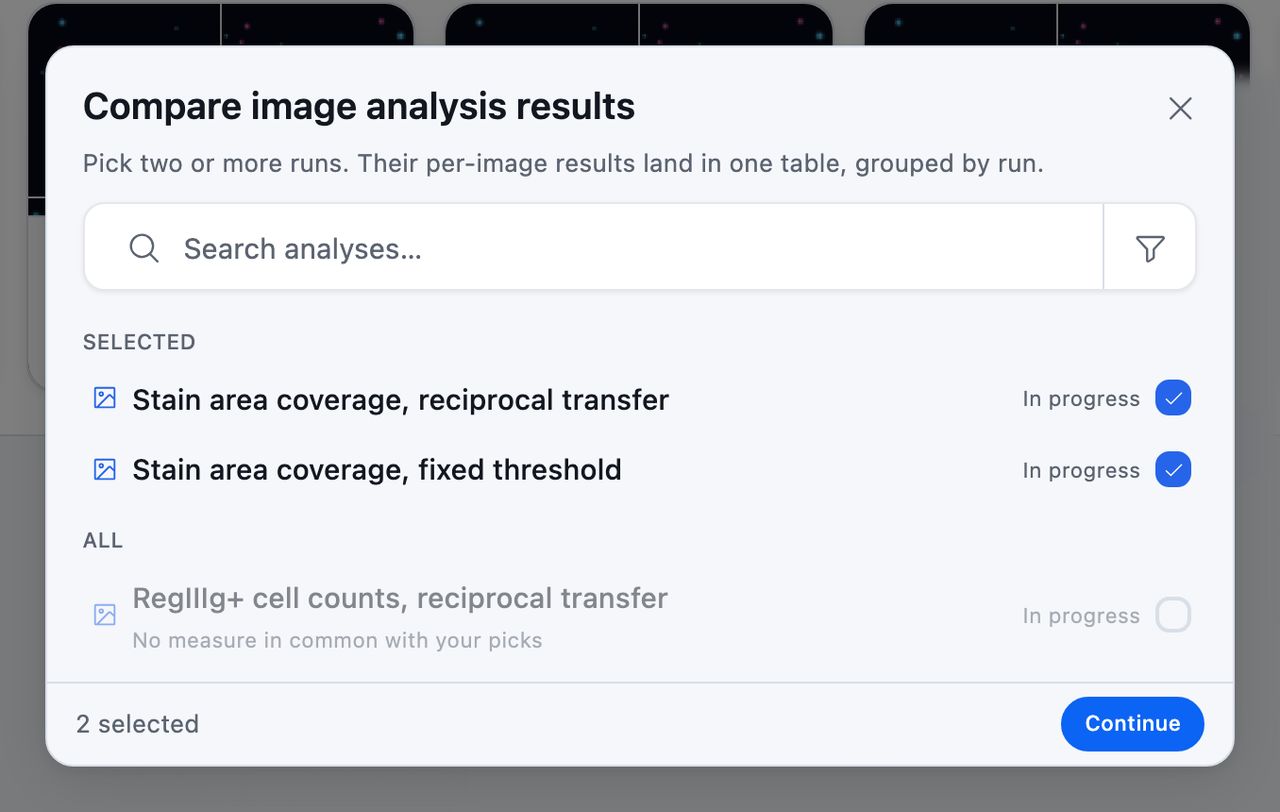
The first step is picking the runs. The funnel at the right end of the search box narrows a long list by Status, Edited, and, once more than one person has made a run, Created by. With the search box empty the list stops at the 30 most recent, so type a name to reach an older one.
A run that can't join your picks stays in the list, dimmed, with the reason under its name:
| Reason | Means |
|---|---|
| No results to compare yet | It has never run |
| No measure in common with your picks | Its numbers and theirs share no column |
Continue takes you to the second step, and Back returns you to the picks.
Picking the Measures
The second step opens on Measures, with every shared measure turned on. Click a measure to leave it out, or use All and None.
Below, Preview gives each group its image count and each measure's mean with a standard deviation, so you can read the comparison before you create it. Two warnings can appear above the preview:
- If the compared images were acquired at different pixel sizes, a warning flags it, because an area measured at one pixel size doesn't compare directly with one measured at another.
- Runs built from different versions of one template get a warning too, naming the template and the versions, since each version can measure with different settings.
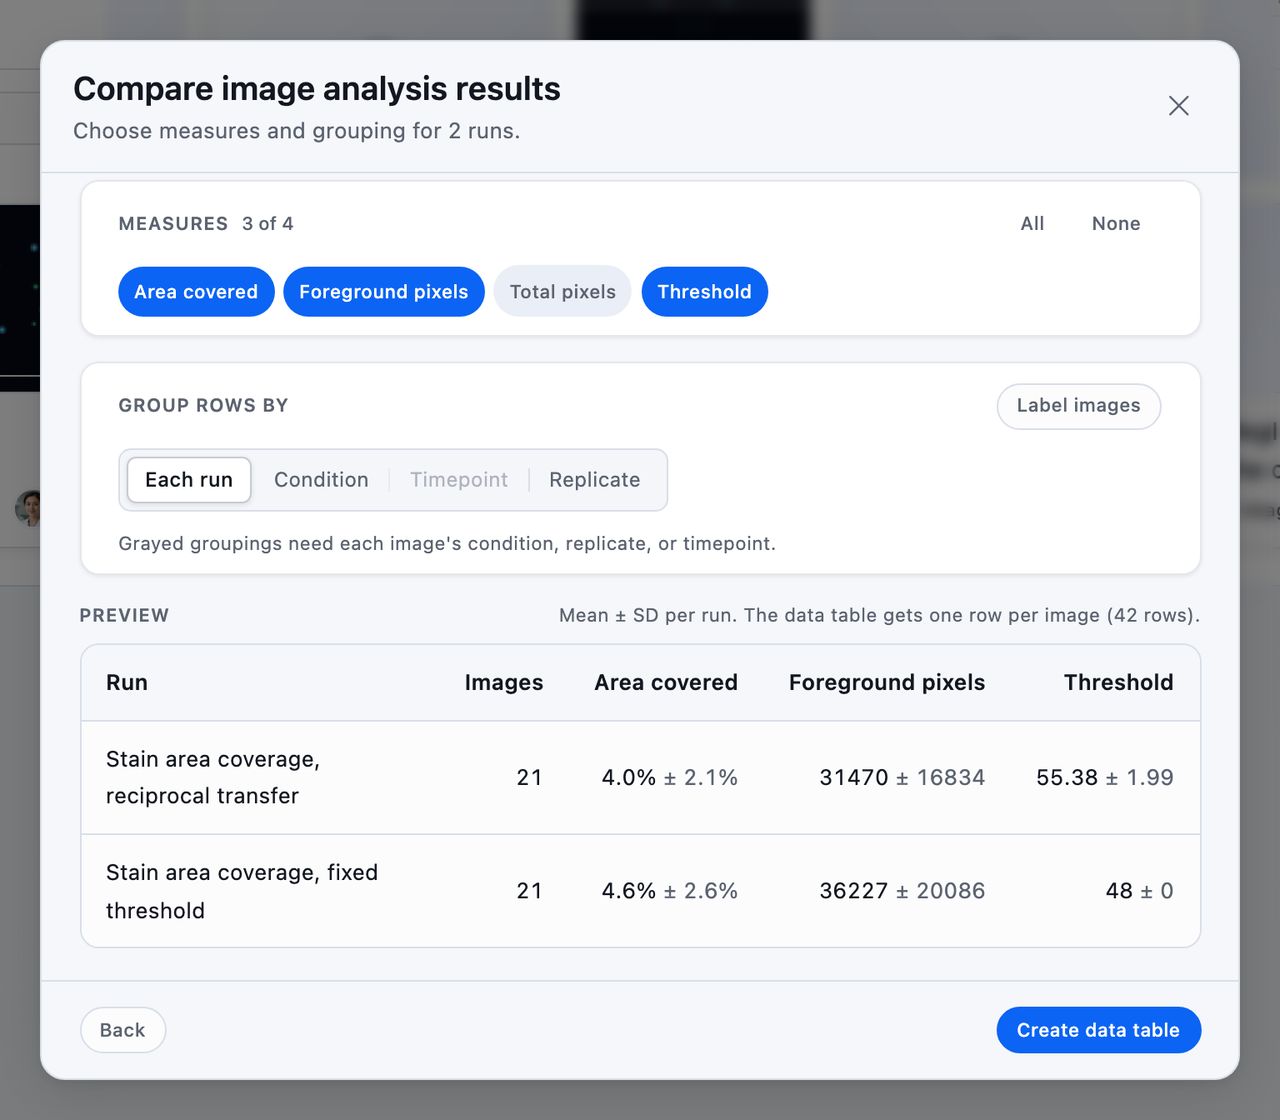
Create data table builds it and lands you in Data Tables on a table with one row per image and a Group column naming each row's run, with the chart already open.
Grouping by Condition, Timepoint, or Replicate
Group rows by starts on Each run and switches the comparison to Condition, Timepoint, or Replicate, and the preview's first column follows. Those three read the experiment design recorded on the images, so they stay grayed until the images carry it.
Labeling the Images
Label images, in that same step, opens a grid with a row per image and columns for Condition, Replicate, Timepoint, and Sort order. Type the labels in, or fill the whole grid at once from the filenames.
The same grid is on the ⋯ menu at the top of an analysis, covering that analysis's own images, so you can label them before you have anything to compare.
An image inside a multi-image file, such as a series in a LIF, can't carry a label. A run made entirely of series groups by Each run, with the other three grayed.
Filling the Labels from Filenames
Under Fill from filenames, retype one of your names with {condition}, {replicate}, or {timepoint} where each label sits, and {*} for a part you don't need, such as a plate id or a date. The rest of the pattern has to match the name exactly. A pattern of {timepoint}_{condition}_r{replicate} reads t01_control_r1.tif, since the extension comes off before the match.
As you type, the line under the field shows how many of your filenames fit and spells out what the pattern pulls from one of them, so you can see it works before Apply pattern fills the grid. A name the pattern doesn't fit keeps whatever labels it already has.

Every cell stays editable before you save. Sort order is the number a timepoint sorts by, so t9, t10, t11 land in that order along the axis. Filling from filenames takes that number from the first run of digits in the timepoint, and you can type over it. Save labels turns on the grouping you needed.
Tip: The same runs grouped a different way make a second table, so a per-run comparison and a per-condition one can sit side by side in Data Tables.
Reading the Result
A timepoint comparison keeps the course in its stored order, so a growth or closure curve reads left to right. Every other grouping sorts its groups alphabetically. Images with no label for the grouping you chose gather in an Unlabeled group at the end.
The table stays linked to its source runs. When a source run's numbers change, the column header carries a dot reading Source data changed since last refresh, and Refresh from source in that column's menu pulls the new values in.
For error bars or a significance test, add the chart to a figure and use its Comparisons step, or run Compare groups from the table's Analyze menu, which is a t-test or ANOVA on a value column across groups. Data Tables covers the table itself, and Customize a Chart covers the chart.