Sequence design, and the tube in the freezer it turns into
Cloning, CRISPR, and primer design in the browser, with every construct still connected to the stock it became, the gel that confirmed it, and the figure it ends up in.
The molecular biology bench, in one browser tab
Design
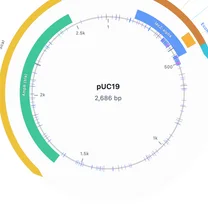
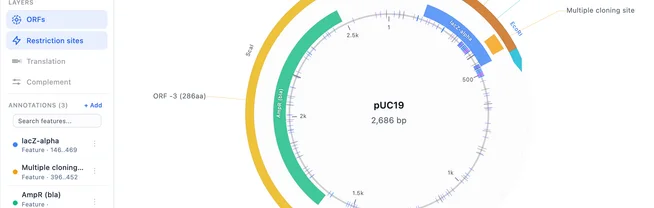
Plasmid maps, restriction analysis, and a cloning wizard with gel visualization in the browser. Versioning and lineage record which parent a construct came from and which version of the map was current when it was built.
CRISPR
Guide design and primer design sit next to the sequence they target, and the oligos you order stay linked to the construct they were made for, so an order placed in March is still attached to the guide it came from.
Catalog
Constructs, strains, and cell lines are samples with structured metadata and lineage, each carrying the map it was designed from and the stock it became. The catalog and the inventory are one record, and both come with every plan.
Freezer stocks
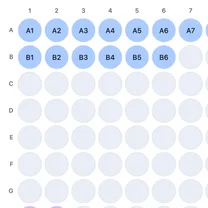
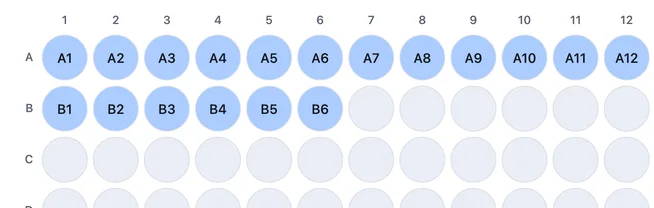
Map freezers, shelves, and boxes so a construct's stock has a real location, attached to the sequence it holds. Clone 7 resolves to one box and one position, and the tube you pull is the one the map describes.
Verify
Align the read against the designed sequence, with the verification attached to the construct it verifies, so the record still says which clone passed six months from now. Bring the read in as FASTA or GenBank from your basecaller.
Gels
Gel and microscopy images attach to the same sample as the construct, with intensity and area measurement in the browser, so the gel that confirmed a clone opens from that clone's own record.
Figures
Charts are built from the underlying data, and multi-panel figures are assembled from the analysis rather than screenshotted beside it, so every panel points back at the data behind it.
Writing
Notes, protocols, sequences, and figures sit in one project, so an entry points at the construct it's about, and the map, the gel, and the verification are one click from the text describing them.
Questions molecular biology labs ask
Can I design constructs, primers, and CRISPR guides in the browser?
Yes, all of it, with nothing to install. Open a construct as a plasmid map, drag out a region, and design PCR primers or CRISPR guides against exactly those bases, or codon optimize the selection for the organism you are expressing in. Restriction Digest picks the enzymes, lists the fragments with both of their ends, and draws the gel you would run, so a mess of comigrating bands shows up on screen first. Construct assembly joins parts from your library into a new sequence that records what it was built from.
Can a construct and the tube in the freezer be one record?
Yes. Register a sequence and it carries an identifier the lab can write on a tube, like PL-0001, plus the fields that entity type needs. The stock itself is a sample with structured metadata and a real location, down to the position in the box on the shelf. Connections draws the trail from either end: what a construct came from, what was built from it, and the samples and results linked to it.
Can I bring in my existing plasmid maps and stock lists?
Yes. Sequences import as FASTA, GenBank, or SnapGene .dna, several files and several records at a time, and a GenBank record brings its annotations and its topology, so a circular plasmid opens as a plasmid map. Spreadsheets of stocks come in as CSV or TSV, with the column headers matched loosely against the ones other lab tools export, so a sheet usually maps without editing. Name is the only column that has to be there.
Does Conspecta run NGS pipelines like Nextflow?
Your workflows keep running where they run today, and you connect them to Conspecta. A Nextflow or nf-core process, a Snakemake rule, or a plain Python or R job can pull the files it needs through the API and write its tables straight into a data table beside the constructs and samples that produced them, so the figure gets built from the same record rather than from a CSV on a laptop. A finished table imports by hand as CSV or TSV just as well.
Connect your pipeline to ConspectaHow much does it cost?
Conspecta is free for you and one collaborator, with no credit card. Academic teams pay one flat rate for the lab rather than a per-seat license, so a rotation student can be added and removed without changing the invoice. Every plan includes every workspace, so the sequence tools, the construct catalog, and the freezer map all come in the same subscription, and the API your scripts and pipelines reach the data through opens up on any paid plan.
See it on your own construct
Import a plasmid map and keep the sequence, the clones it produced, and the gel that confirmed them in one project.