Flow cytometry, imaging, and mice, in one immunology workspace
An immunology experiment is one story told across four tools. Conspecta keeps the FCS file, the tissue image, the animal it came from, and the figure it ends up in inside a single project.
The immunology bench, in one browser tab
Import
Upload the FCS files into the project the samples already live in, so a run lands beside the panel and the animals it came from the day it comes off the cytometer. Conspecta starts where the cytometer stops, and is not acquisition software.
Compensation
Compensate from the spillover matrix embedded in the FCS, from an imported CSV matrix, or auto-computed from a single-stain control file. The controls stay in the project beside the panel they compensated, so the matrix and the files behind it are one record.
Gating
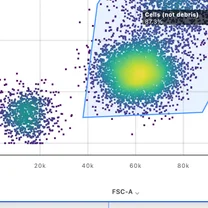
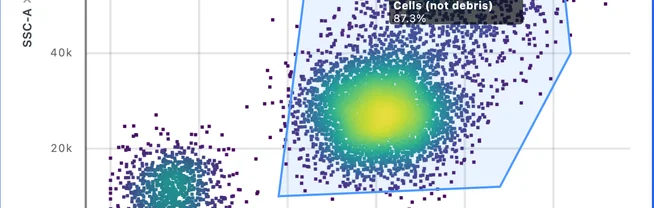
Rectangle, polygon, ellipse, quadrant, range, and boolean gates, saved as a reusable hierarchy the whole lab gates from. The strategy belongs to the project, so it stays in the lab when the postdoc who drew it graduates.
Clustering
UMAP, t-SNE, PCA, SOM and graph clustering (FlowSOM-style and PhenoGraph-style), K-means, and DBSCAN, all in the browser with nothing to install. You run it yourself, on the day you need the answer.
Imaging
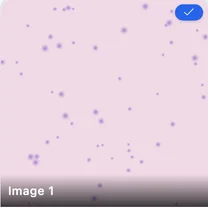
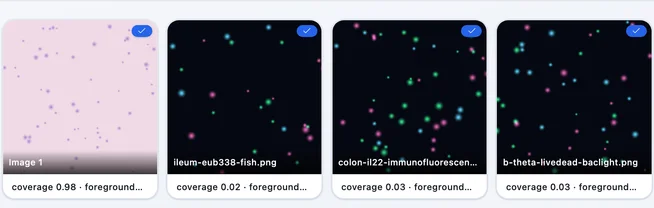
Open an image and a segmentation model counts every cell, with no threshold to tune. Area, marker intensity, and multi-channel z-stacks on LIF, TIFF, and PNG in the browser, attached to the same sample as the flow data from that mouse, so the spleen section and the FCS file sit on one record.
Stats
Gate statistics feed charts, MFI comparisons, and kinetics directly. Adjust a gate and the numbers downstream follow it, and each chart still names the gate behind it.
Mice
Timepoint, condition, and genotype are fields on the sample, so mouse 4, day 14, IL-10 knockout is something you filter on. Each FCS file links to the sample it was measured from and carries that context into every plot built from it.
Write-up
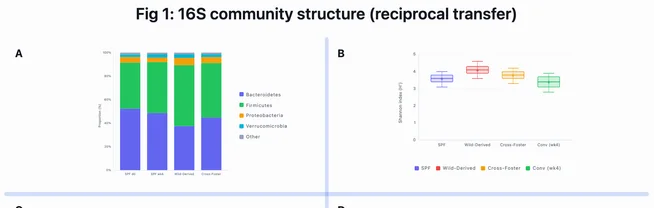
Notes, flow analysis, and multi-panel figures sit in one project, and the figure is built from the analysis rather than pasted next to it. An entry points at the gate it describes, so a re-gate reaches the panel in the figure.
Questions immunology labs ask
Can I gate FCS files without installing FlowJo?
Yes. Compensation, gating, clustering, and statistics run in the browser, on a Mac, a Chromebook, or a managed institutional laptop with no admin rights. A strategy you already have comes in through Import gating, which reads a FlowJo 10 .wsp workspace or a Gating-ML 2.0 file in your browser, and the analysis exports back out as .wsp. Gates you draw here save as a template that applies to every file in the next run.
Can I run FlowSOM-style clustering or t-SNE in the browser?
Yes. UMAP, t-SNE, and PCA sit alongside K-means, DBSCAN, density, SOM, and graph clustering, with nothing to install. The SOM and graph methods are written in the style of FlowSOM and PhenoGraph rather than ported from the R packages, and Conspecta says so in the dialog box, so you can report them as what they are.
Does Conspecta support spectral flow cytometry?
Conspecta compensates from a spillover matrix and does not do spectral unmixing. Unmix in the software that shipped with the instrument and import those files: unmixed at acquisition, they carry one column per marker and load like any other FCS. A FlowJo workspace whose gates sit on values the workspace unmixed is refused rather than read wrong, and the message says to bring the unmixed files instead.
Can I keep immunofluorescence images with the flow data from the same mouse?
Yes, and it is the reason to run both here. Upload the section, answer a couple of questions about what you are measuring, and Conspecta assembles a detection that counts cells and reads per-cell marker intensity across channels. The image and the FCS file both point at the sample they were taken from, so that animal's Connections tab lists them together and one figure can draw on the gated population and the stained section.
How much does it cost?
Conspecta is free for you and one collaborator, with no credit card. Academic teams pay a flat per-lab rate for a shared workspace rather than a per-seat license, so a new postdoc joining does not add a line to the invoice. Every plan includes every workspace.
See it on your own panel
Drop in an FCS file and start gating in the browser. Nothing to install, and no license tied to one machine in one building.