Plate imaging, strains, and sequences in one microbiology workspace
The colony count, the strain it came from, the freezer box it lives in, and the sequence that identifies it are four records in four tools. Conspecta keeps them as one.
The microbiology bench, in one browser tab
Imaging
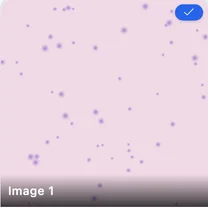
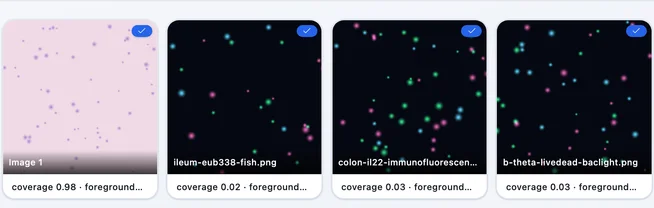
Object detection, area coverage, and intensity measurement on LIF, TIFF, and PNG in the browser, with every image attached to the strain and the plate it was taken from. The number a plate produced stays on the image that produced it.
Counting
Open a plate image and the detector counts every colony, with no threshold to tune. The setup stays with the analysis and re-runs across the whole series, with the parameters stored beside the count, so repeating the assay next year starts from the setup that produced the first one.
Biofilms
Coverage, area, and intensity measured the same way across the series, on flat images and on confocal z-stacks. The region is detected rather than traced by hand, and the settings save alongside the result, so the next plate is measured the same way.
Strains
Strains and isolates are samples with structured metadata: passage number, growth conditions, and resistance markers as typed fields on one shared record. Every image, sequence, and result that came from a strain stays attached to it.
Freezers
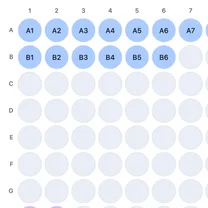
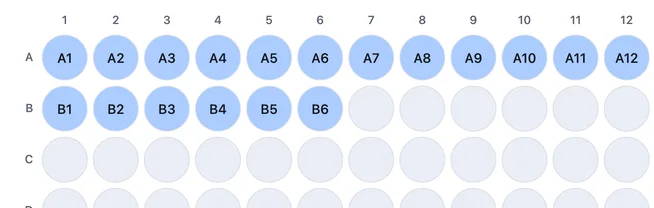
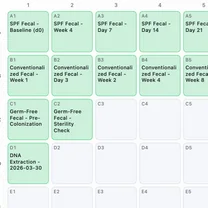
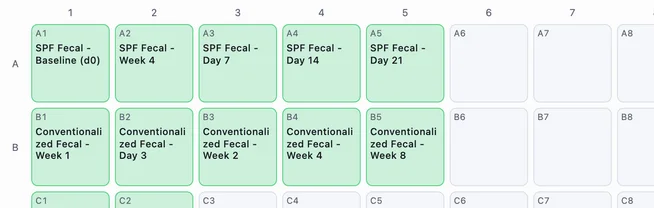
Map freezers, shelves, and boxes, and give every strain a location that travels with its record. Move a tube or a whole box and the record follows, so the freezer and the map agree.
Sequences
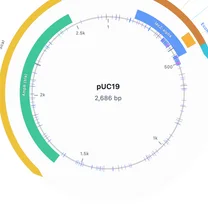
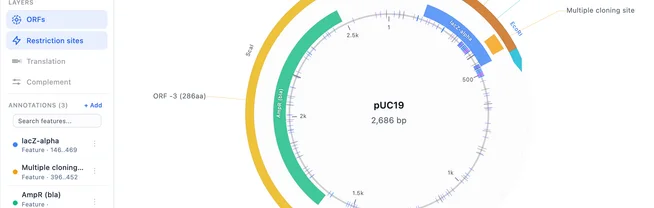
BLAST, alignment, phylogenetics, and restriction analysis, all attached to the strain the sequence identifies, so the tube in the freezer and the read that names it are one record.
Amplicon
Import the abundance table as CSV or TSV into a data table beside the samples it came from, and read the tree into the phylogenetics viewer as Newick. The figure gets built in the same project as the samples behind the table. Conspecta analyzes pipeline output and does not run the pipeline.
Figures
Charts are built from the counts themselves, and notes, protocols, and multi-panel figures live in the same project as the plates, so a finished panel traces back to the plate behind it.
Questions microbiology labs ask
Can I count colonies automatically?
Yes. Open a plate image, answer a couple of questions about what you are measuring, and Conspecta assembles the detection pipeline. Tune it on one plate, then run it across the whole dilution series. The settings that produced a count stay stored with the count, so repeating the assay next year starts from the analysis rather than from re-deriving thresholds.
Can Conspecta measure biofilm coverage or zones of inhibition?
Yes, on flat images and on confocal z-stacks. Area, coverage, and intensity are measured the same way across a series, and a stack can be stepped through a plane at a time, flattened with a maximum intensity, average, or sum projection, or turned as a volume in the 3D view. Reconstructing surfaces and tracing filaments are outside what Conspecta does.
Does Conspecta run 16S or metagenomics pipelines?
Your pipelines keep running where they run today, and you connect them to Conspecta. A Nextflow or nf-core run, a Snakemake rule, or a plain Python or R job can pull the files it needs through the API and write its numbers straight into a data table beside the samples they were measured from. BIOM abundance tables, QIIME 2 .qzv files, and plain CSV or TSV import directly too, and a tree reads into the phylogenetics viewer as Newick, so the figure gets built in the same project as the plates.
Connect your pipeline to ConspectaCan I track strains, passage numbers, and freezer locations?
Yes. Strains and isolates are samples with structured metadata, including passage number, growth conditions, and resistance markers, and every image, sequence, and result that came from one stays attached to it. Freezers, shelves, and cryo boxes are mapped, so every stock has a location that travels with its record.
How much does it cost?
Conspecta is free for you and one collaborator, with no credit card. Academic teams pay a flat per-lab rate for a shared workspace rather than a per-seat license, so adding a rotation student does not add a line to the invoice. Every plan includes every workspace, and the API your scripts and pipelines reach the data through opens up on any paid plan.
See it on your own plates
Upload a plate photo and get the count back in minutes. Nothing to install, and the count stays with the image it was measured from.