Design a Flow Cytometry Panel
Design your flow cytometry staining panel where your instruments, your antibody stock, and your acquired controls already live. You lay out markers and fluorochromes, and Conspecta scores every pairing on the cytometer you pick, shows what your lab already owns, and keeps the finished panel as a record your whole team can open and reuse.
Panel design is in closed beta. Ask us for access and we'll switch on the Panels tab for your account.
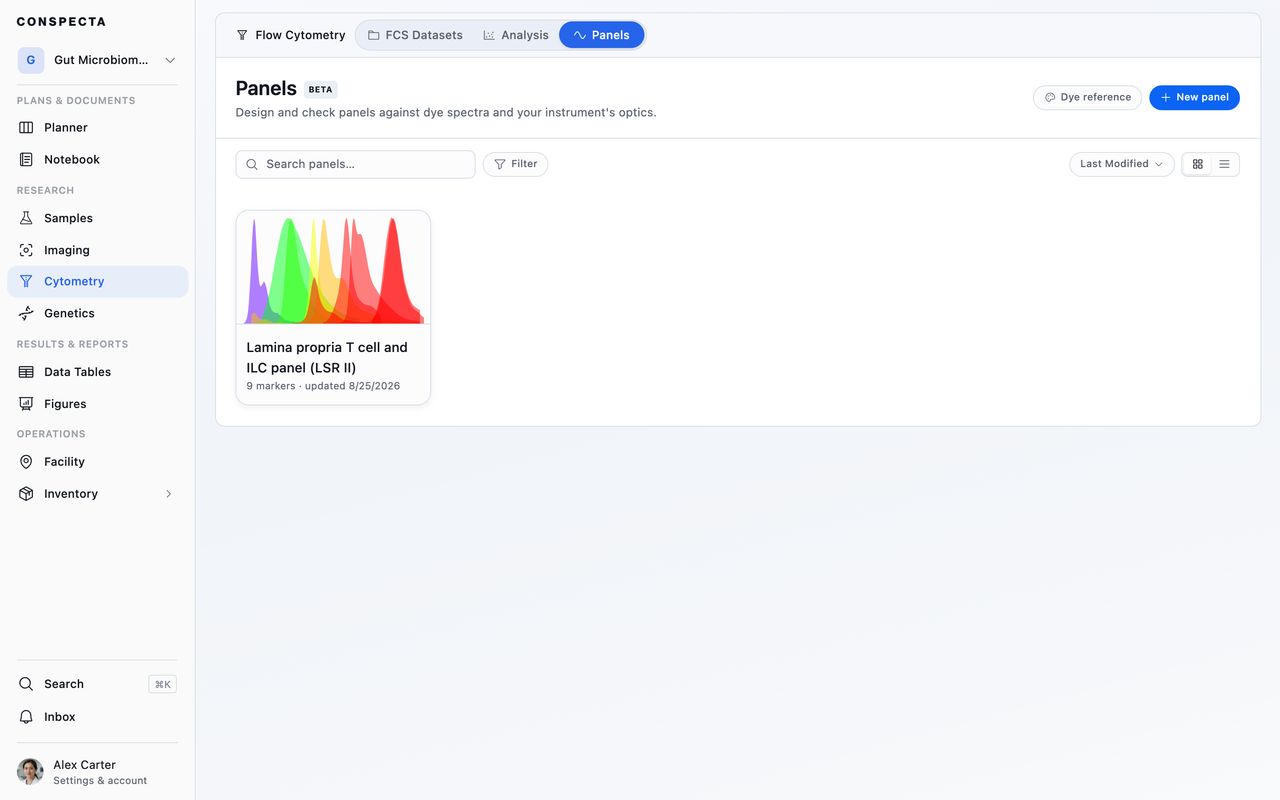
Create a Panel
- Open the Cytometry workspace and go to the Panels tab.
- Press New panel, name it, and choose whether it is private or shared.
- Type a first pass at the roster, one line per marker with the dye it's on. One dye is enough to start, and the markers stay editable afterwards.
The panel holds a row per marker, with columns for Marker, Fluorochrome, Clone, Titer (µL/test), Stain index, and Notes. The marker and fluorochrome cells drive the checks below. The other columns hold the facts a panel spreadsheet usually keeps, so the clone and titer travel with the panel.
A panel is a project record. Share it with your team, star the ones you reach for, and open the panel a run used months later.
To cite a panel in a note, pick Link a panel from the note's Insert menu. The note shows the panel's instrument and marker count, and as a preview each marker's dye and the dyes' spectra. Clicking it opens the panel here. See Write Lab Notes.
Start From a Spreadsheet
Most labs already keep their panels on a sheet, and Conspecta reads an Excel workbook, a CSV, or a TSV file into a new panel.
- Press New panel and choose the Import a spreadsheet tile. An empty library offers Import a panel for the same thing.
- Choose the file. Every column in your sheet is listed with a few of its values, beside the panel column it will become, with a Preview (first 10 rows) underneath.
- Change any match from the dropdown beside it, and set a column you want left out to Don't import.
- Edit the name, which starts as the file's name, and import.
Columns are matched by name, and the usual spellings are covered.
| Your sheet's header | Becomes |
|---|---|
| Antigen or Target | Marker |
| Conjugate or Dye | Fluorochrome |
At least one column has to become Marker or Fluorochrome, because those are the two the checks read. The other four are optional, and a row with no dye yet imports as an empty slot.
The panel arrives with no instrument bound, because a spreadsheet carries none. Pick the cytometer and the check scores the panel on the machine you will acquire on. A dye your sheet spells differently from the registry stays as written and reads as unscored until you correct it.
This reads the Worksheet (.csv) file Conspecta writes as well, so a panel exported from one project imports into another.
Ask Your AI Assistant to Draft One
A connected AI assistant can do the first pass and the fixes that follow. Ask it to:
- Draft a panel. Tell it the markers you need and the cytometer you are running on, and it adds the panel to the Panels tab, bound to that cytometer, with the check above the grid when you open it.
- Suggest markers. Ask which markers answer your question and it picks from the curated list the Marker field suggests, each with a one-line note on what it reports.
- Build from your stock. It reads the fluorochrome on your inventory items the same way the Dye reference does. Where two dyes both resolve on your cytometer it picks the one you already hold, and it tells you when a dye it wants would have to be ordered.
- Score the panel. It tells you which pairings scored worst, and those scores match what you see when you open the panel yourself.
- Fix a flagged pairing. It swaps the dye on that row and leaves the clone, titer and notes as you typed them.
- Rename a panel. The columns, the rows and the cytometer it is bound to all stay as they were.
A conjugate recorded as "Brilliant Violet 421" counts as the BV421 you own. Where an item leaves the fluorochrome field empty, Conspecta reads the dye out of its name, so a conjugate recorded as "CD127 BV605 (clone A019D5)" counts as the BV605 you own. A name that could mean more than one dye stays unmarked until you record the dye in the field.
It takes dye names from the registry the Dye reference shows, so every dye it writes can be scored. Open the worksheet whenever you want to take over.
Switch to Design
A panel opens on Review, the read-only summary covered in Review a Flow Cytometry Panel. Press Design, at the left of the header band, to change it. Picking the instrument and Open worksheet are both there.
Pick the Instrument
The same two dyes can resolve cleanly on one cytometer and collide on another, so a panel is always checked against a machine. The header band above the check reads Pick an instrument until you choose one. The picker lists your own machines first. Under Compare with another model are the catalog models this panel does best on, and typing a name searches your machines and the whole catalog together.
| You pick | The panel is scored against |
|---|---|
| One of your lab's cytometers | The lasers and detectors recorded on its instrument profile. These are the most accurate scores. |
| A model from the catalog | The manufacturer's typical configuration. The check notes that, because installed filter sets vary from site to site. |
| Emission shape only | The dyes alone, with no machine. |
The arrow at the end of each of your own machines' rows opens that machine's page in Facility, to book it or check its setup, without changing what the panel is scored on.
When the bound cytometer's latest QC run failed or passed with warnings, a warning mark sits beside its name in the header band. Hover it to see the result and when it ran. Review names the markers it affects, as Check the cytometer's latest QC describes.
Compare on Another Cytometer
The first machine you pick is the one the panel is bound to. Picking another machine after that starts a comparison. Every number redraws on the new machine, and a Comparing bar shows that the panel is still bound to the old one.
- Bind to keeps the new machine.
- Back to drops it.
That way you can try a panel on the cytometer down the hall and leave it bound to the one it was designed on.
Add Optics to a Cytometer
A cytometer with no optics recorded has nothing to score against, so the panel check and your assistant both stop there. The picker still lists it, with Add optics in place of a verdict, and the row opens that machine's optical configuration over the panel. Fill it in one of three ways:
- Take the manufacturer's published setup.
- Read the geometry out of one of your FCS files.
- Type the lasers and filters in yourself.
Save it and the picker selects that machine for the panel, scored on the configuration you recorded. The same fields live on the machine's own page in Facility if you would rather set it up there.
Where the machine is one of the models Conspecta publishes a configuration for, your assistant can record that configuration onto the instrument for you, and it lists the lasers and detectors it wrote so you can check them against the bench. A cytometer that already has optics recorded keeps them unless you ask for them to be replaced, because what is there may be your own corrected version.
Read the Panel Check
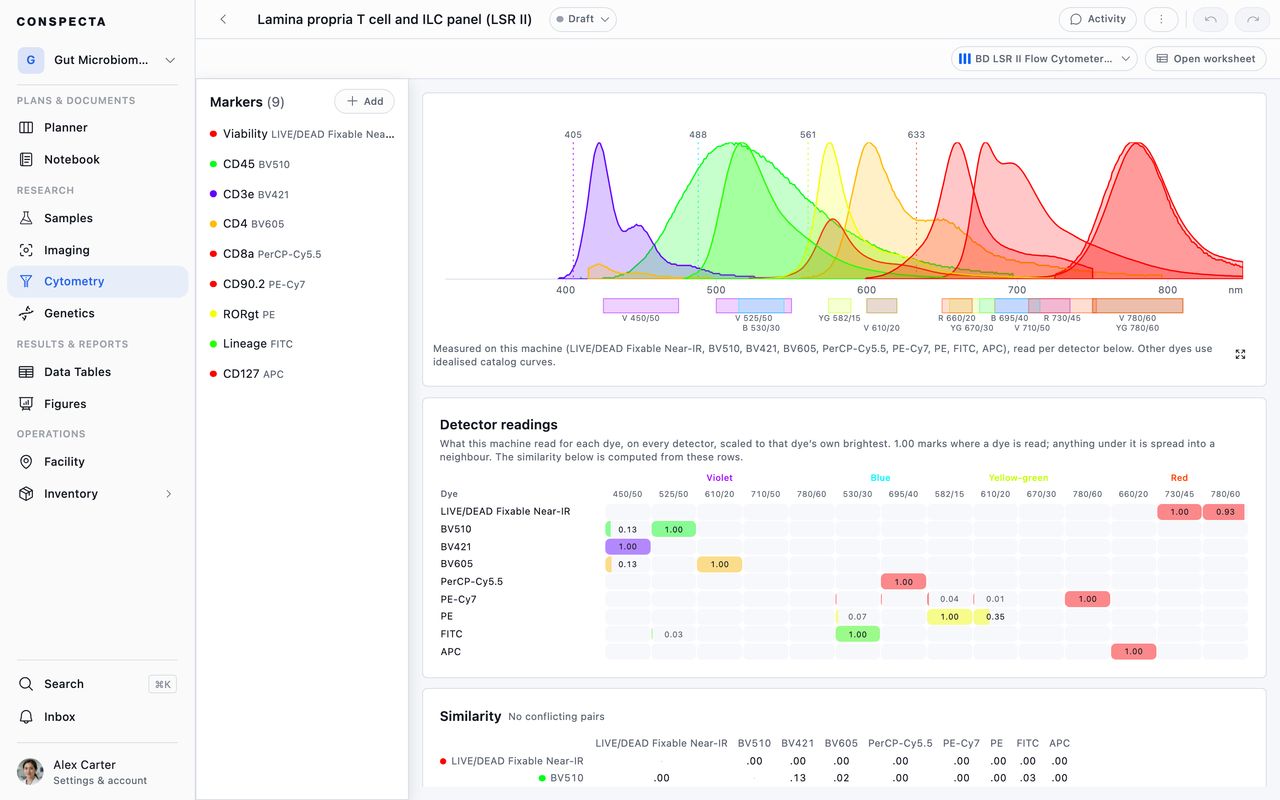
The verdict sits in a band across the top of the panel, in the design view and above the worksheet grid alike. Every fluorochrome Conspecta recognizes is scored against every other on the chosen instrument, and the pairs most likely to cost you resolution are flagged on their rows, worst first.
In Design, the spectra stay at the top and the analysis sits in tabs under them. A tab shows only when it has something to draw.
| Tab | What it shows |
|---|---|
| Detector readings | What the machine reads for each dye, with a count of the dyes read |
| Similarity | How alike every pair of dyes looks, from 0 to 1 where 1 means identical, with a count of the pairs flagged. Hover a cell to see which of the two dyes was measured on the instrument |
| Spillover spread | What each dye costs every detector, once you have read controls |
| Best fits | Dyes ranked for the next slot. Viewers don't get it, since it adds dyes to the panel |
| Marker | The marker you selected, first in the row of tabs. Select another and it takes that one's place |
A few flags come ahead of any score, such as two markers on one fluorochrome or a dye name the registry doesn't know. What the flags mean lists them.
The check scores spectral overlap. Controls and validation stay at the bench, and the panel is where you record what they show. For titration, compute the stain index from the tubes you acquired.
Open the Worksheet
Review and Design both read the panel as a picture. Open worksheet shows the same panel as a grid, with one row per marker and one column per field, edited as cells. Type the clone and the notes here, and add or reorder rows. You can type the titer and the stain index here too, or compute them from the titration tubes.
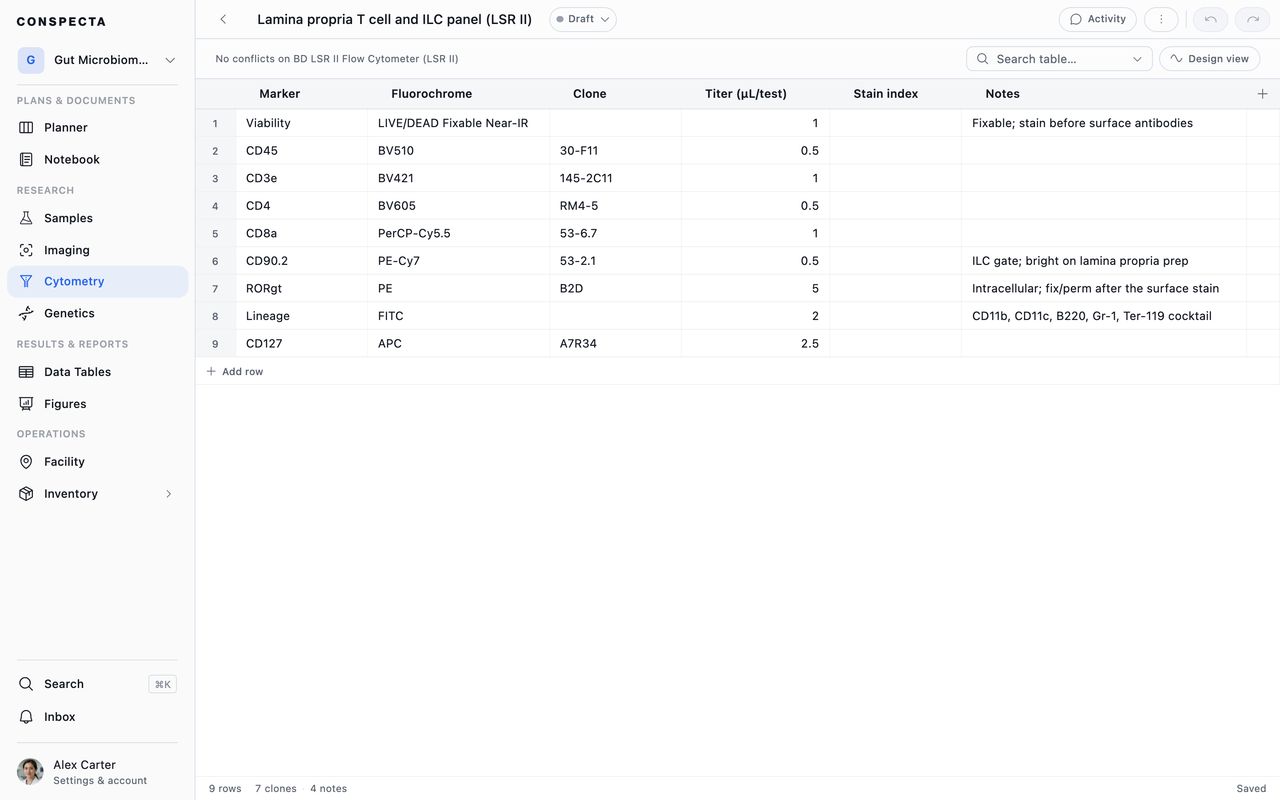
Design view goes back.
Score From Your Own Controls
Published spectra are idealized curves. Your acquired single-stain reference controls measure what each dye does on your machine.
- Open the Dye reference and press Upload controls. You can also press Upload controls on the cytometer's own page in Facility, which stores the files against that machine without asking.
- Choose the FCS files from a reference run. Each tube is matched to its dye by its file name, so "LIVE-DEAD Fixable Near-IR ctrl.fcs" finds LIVE/DEAD Fixable Near-IR.
- Check the Quality column. Good means the stained events stand well clear of the unstained ones. Weak means they sit less than three times brighter, so the reading is too soft to design against, and running that control again is worth it.
- Press Save at the bottom right. The measured signatures are stored for that cytometer.
From then on, every panel checked on that machine scores with your measured signatures ahead of the catalog curves, and dyes you compare show a brightness measured from your own control on that instrument.
The dye field takes a fluorochrome the registry has no entry for. Type the name and the row saves under it, marked as a dye named only by your own controls. Any panel using that dye on the same cytometer is scored from the control you read. Check the spelling before you save, because the name is the only thing that matches the control to a worksheet row.
One cytometer holds 500 measured signatures. A dye counts once for each lot you record it under, and the count covers every project and every lab that shares the machine, because they all read the same measurements. At the limit, you are asked to delete a signature before reading another control.
A spectral cytometer that covers a few hundred detectors at once stores a much larger signature for each dye, so a machine like that reaches the limit at around 400 signatures.
Reading a control again for a dye and lot you already have replaces that signature, so you can always refresh controls you have read before.
Spillover Spread
Once controls are read, Spillover spread appears beside the similarity matrix. Similarity shows whether two dyes look alike. Spread shows what one dye costs another's measurement. Light leaking into a neighboring detector brings its own noise, and compensation takes the average leak back out but leaves the noise, so the neighbor's population stays wide. On panels above about twenty colors, spread is the main figure to design against.
The grid has dyes down the side and detectors across the top, and it is asymmetric, because what a bright dye costs a dim marker differs from what the dim marker costs it back.
- Read a row for what one dye costs every detector.
- Read a column for what lands in one detector.
- Spread against each marker, worst first, under the grid, totals every other dye in the panel against that marker's detector, so you can see which marker to move. A long panel lists the six hardest hit, each with a bar against the panel's own worst, and Show all opens every marker.
Use spread to rank the panel and find the marker to move, and keep it out of published results.
A dye you have not read a control for on that machine is listed as unmeasured. Published curves cannot fill the gap, because nothing published describes how noisy your particular machine is. A total summed without one of those dyes leaves out what that dye adds, so the figure is marked ≥ and the row shows how many dyes it counted.
Each figure divides out how brightly the control was stained, so it describes the dye and the detector on that machine, independent of any one run. That makes it comparable between dyes on the same cytometer only.
It also comes from one control per dye, which makes it a single-point estimate, less precise than a spreading matrix fitted across a titration.
Compute a Stain Index
A panel row carries the dilution an antibody is used at and the stain index that justified it. Type both in from another tool, or compute them here from your titration tubes so the row records where they came from. The stain index is measured from the negative population each tube already carries, so it works on a titration with no gating on it.
Run a Titration
- Pick a marker in the design view and press Titrate. It opens on the project's runs, and searching matches a run by name.
- Open the run and tick the tubes it was titrated on.
- Check each tube's dilution. It fills in where the tube name says what it was run at, and you type it where it does not.
- Press Compute. Each tube is scored on the detector named under Measured on, which you can change if the tubes label their channels some other way.
- Read the curve of stain index against dilution beside the table. The best dilution is marked, and the rest stay on screen so you can see where the curve turned over.
- Press Accept to write the winning dilution and its stain index onto the row.
Accepting records the tubes, the detector and the date under the fields, so months later you can tell which numbers were computed and which were typed. The last 10 titrations you accept are kept for each marker, so titrating a marker again adds to its record.
When the run came off a plate, Read dilutions from a plate asks which plate record it was, then fills each tube's dilution from its well and marks it from the plate. A dilution you typed yourself is left as it is.
The unit travels with the value, so a series run in µg/mL records µg/mL, even though the column header says µL/test. Nothing is converted between the two, because that needs a stock concentration no record here holds.
A tube run at zero, or at a dilution that isn't a number, stays in the table but has no point on the curve.
Accepting a titration sends a signed-off panel back for a re-check. It changes the sheet, so the sign-off reads as needing a re-check.
When a Tube Has No Score
| Status | What it means |
|---|---|
| Unscored | The tube holds too few events to call, or has no negative population to measure against. The reason is shown, and the tube is never ranked as a zero. |
| Nothing above background | The tube read cleanly and no stained population rose out of it, which points to the dilution. |
| Weak separation | The stained and unstained populations barely pulled apart, so the reading is too soft to pick a dilution on. |
Change the Titer Later
After a titration, the Titer field in Antibody details lists every dilution you measured with its stain index, and the row's latest titration draws its curve under the fields with the current titer marked.
- Pick a measured dilution and Stain index fills in with that dilution's value.
- Type a titer you didn't measure and Stain index is cleared, and the line under the fields says Titer typed by hand.
On a row you never titrated, the two cells are plain fields, and a value you typed stays as you typed it.
Compare Titrations
Once a marker has two or more titrations, Compare titrations in Antibody details lays two to four of them side by side, with:
- their curves on one chart
- each tube's histogram
- each dye against the rest of the panel
- a table of best titer, peak stain index, stain index at your current titer, worst pair and stock
Use this one puts that titration's dye, titer and stain index on the row. Export CSV saves the stain index at each dilution, one column per titration, ready to open in Prism or Excel.
Explore the Dye Reference
Dye reference on the Panels tab opens on All dyes, every dye Conspecta has in one searchable list. Each row carries:
- the dye's emission curve
- its family, its laser line, and what kind of dye it is
- whether your lab holds a conjugate, read from the fluorochrome field on your antibody items, or from the dye in the item's own name where that field is empty
- whether you have measured it on the cytometer named at the top
Search matches alias spellings, so "Brilliant Violet 421" and "BV 421" both land on BV421. View holds the filters and sort orders.
| Section | Options |
|---|---|
| Filter | Laser line, dye type, vendor family, full curves or peak values only, and once they have loaded, what you hold in stock and what you have measured |
| Sort | Laser line, emission peak, name, family, or what you already own |
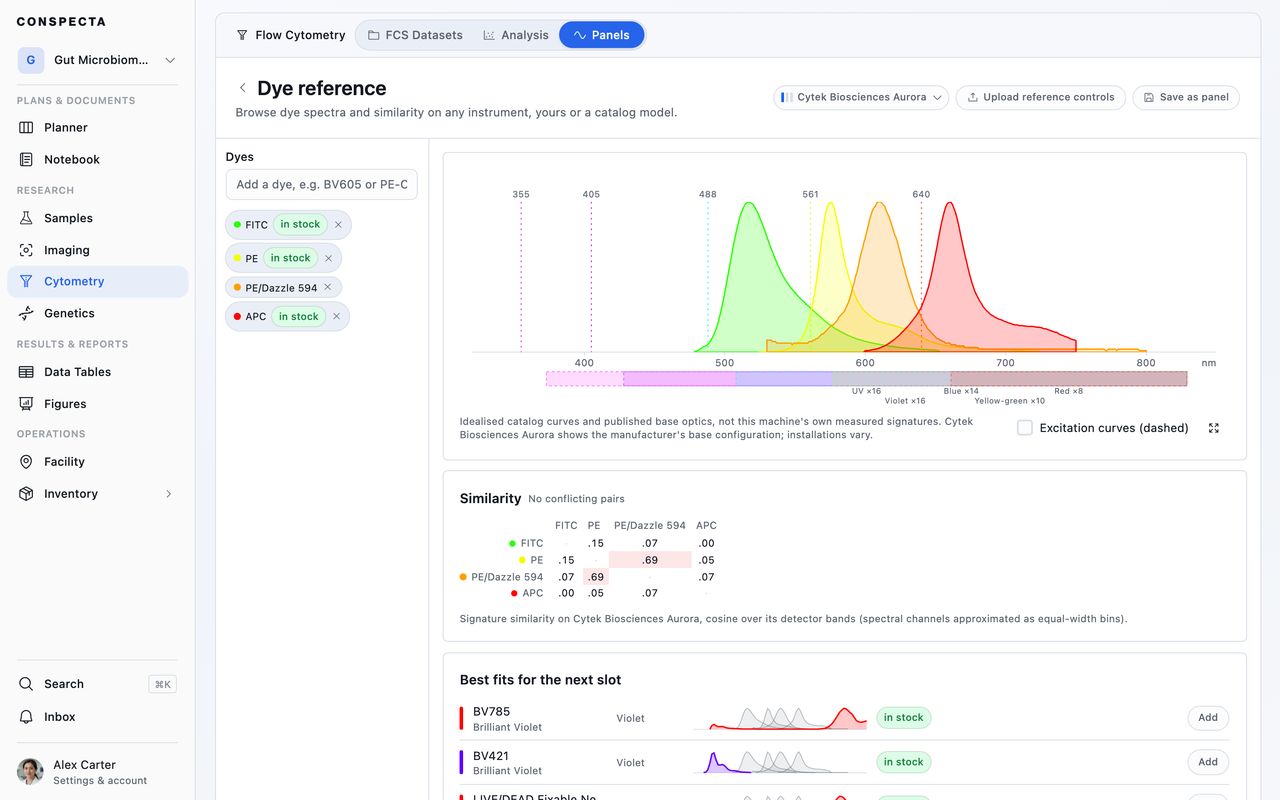
Spectra switches to the chart. Draw emission curves together, add the excitation side with Excitation curves (dashed), and switch instruments to watch the same combination resolve differently on different machines. Tick rows on All dyes to build the comparison, or click a dye's name to open the chart on that one dye.
A dye marked peak facts only has vendor-published peak values behind it and no measured curve, so the chart draws it as markers.
When a combination looks right, Save as panel turns the current selection into a new panel and carries the instrument along with it.
Fill the Next Slot
With a panel and an instrument in place, the Best fits tab ranks candidate dyes for the next slot. A dye counts as working when it resolves on the bound instrument without colliding with the panel. Working dyes are ordered by your stock:
- Dyes you hold, in date
- Dyes you hold whose stock has expired
- Dyes you would need to buy
Brightness measured from your controls is shown alongside and plays no part in the order.
Until the panel has an instrument, the tab carries the same picker as the header band, and choosing a cytometer there brings up the ranking immediately. The dye reference's own Best fits card does the same when the selection is scored on emission shape alone.
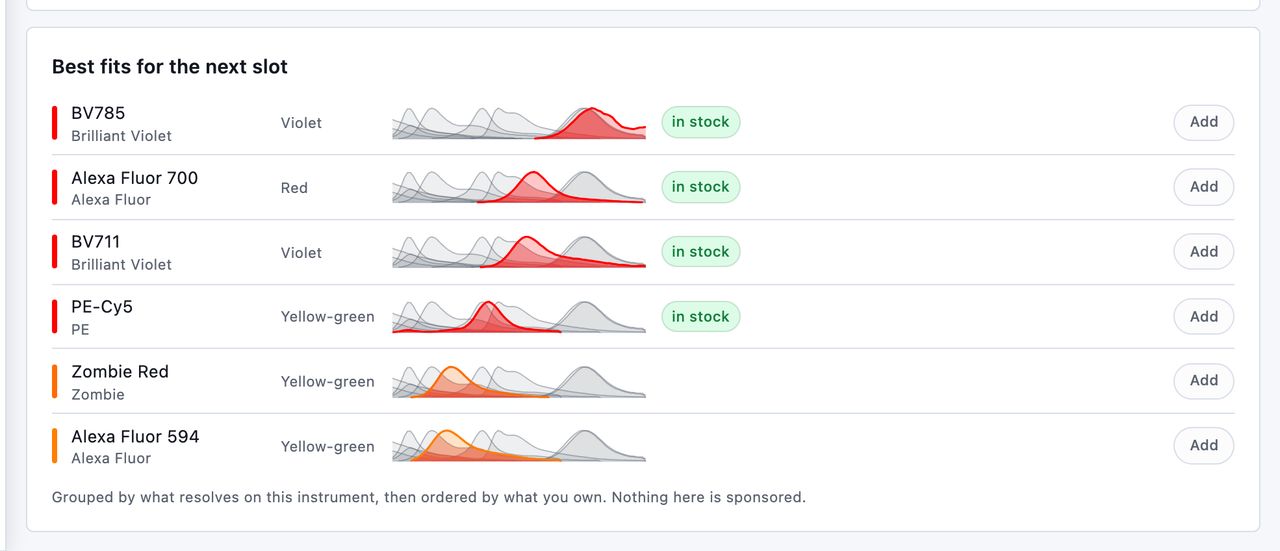
Once a candidate carries a caveat, the list splits in two. While every candidate is clear, the list shows them all in one group.
- Works on this instrument holds the clear ones.
- Worth a second look holds the rest, each naming the panel dye it sits close to or crowds, or noting that it has no curve to score on. A candidate that crowds something stays in the list, dimmed, so you can still pick it on purpose.
Candidates are weighed against every dye on the sheet, including a dye scored from your own control. The note under the list names such a dye, because with no published curve behind it there is no wavelength to draw it at in the row pictures.
Each candidate draws its own emission curve against the dyes already on the panel. Point at a row, or tab to it, and that candidate also draws on the panel's spectra chart above, dashed and named, so you can place it across the full wavelength range.
Pick a Dye for One Marker
Open a marker from the roster and the same ranking sits beside its Marker and Fluorochrome fields as Best fits for this slot. It is based on the panel's remaining spectral room and your stock, so it holds for whichever marker the slot ends up carrying.
Once the row has a dye, its Dye fit verdict takes that space, with the worst pairs it collides with, its slice of the similarity matrix, and Brightness, read from your own single-stain control on the bound instrument. Other dyes opens the ranked candidates in a picker. Until the panel has an instrument, that picker asks for one first.
Copy a Panel
Select a panel on the Panels tab and the bar along the bottom carries two ways to copy it. In the list, each panel's own ⋯ carries the same two, alongside Rename, Star, Download, Share or Make private, and Delete for that panel. Both work on several panels at once.
Duplicate makes a second panel in this project, named <panel> (copy). It carries the full worksheet, with the clone, titer and notes, and stays bound to the same cytometer. Use it to try a swap on a panel that is already running.
Copy to project asks which project first, and puts the copy there. The copy arrives private, so you decide when the other project's members see it, and the check runs against that lab's own instrument.
Where the destination is another lab, its cytometers are its own records, so the copy binds to the machine of the same name and arrives unbound when there is none. Conspecta lists which panels arrived unbound, and you can pick the instrument on each.
A copy in another project starts with no runs. The datasets acquired under the original stay linked to the original, where their version history is. The copy begins its own history the first time tubes are acquired under it.
To export a panel, see who changed it, or hand it to a client lab, see Review a Flow Cytometry Panel.