How Your Work Connects
Conspecta links each result to the work that produced it. A sample shows which images came from it, an image analysis shows which images it measured, and a figure shows which numbers it drew. This page explains how those links are made, what you can do with them, and which links hold a snapshot of the moment they were made.
The Chain
Most work in a lab runs in one direction, and Conspecta records it as it happens:
sample → images → image analysis → data table → chart → figure
       ↘ protocol run → materials consumed
                      ↘ samples produced
Conspecta makes almost all of those links for you. Uploading photos to a sample links them. Running an analysis from a sample links the analysis. Finishing a run records what it consumed and what it produced. Adding a chart to a figure records which table it came from.
Seeing the Connections
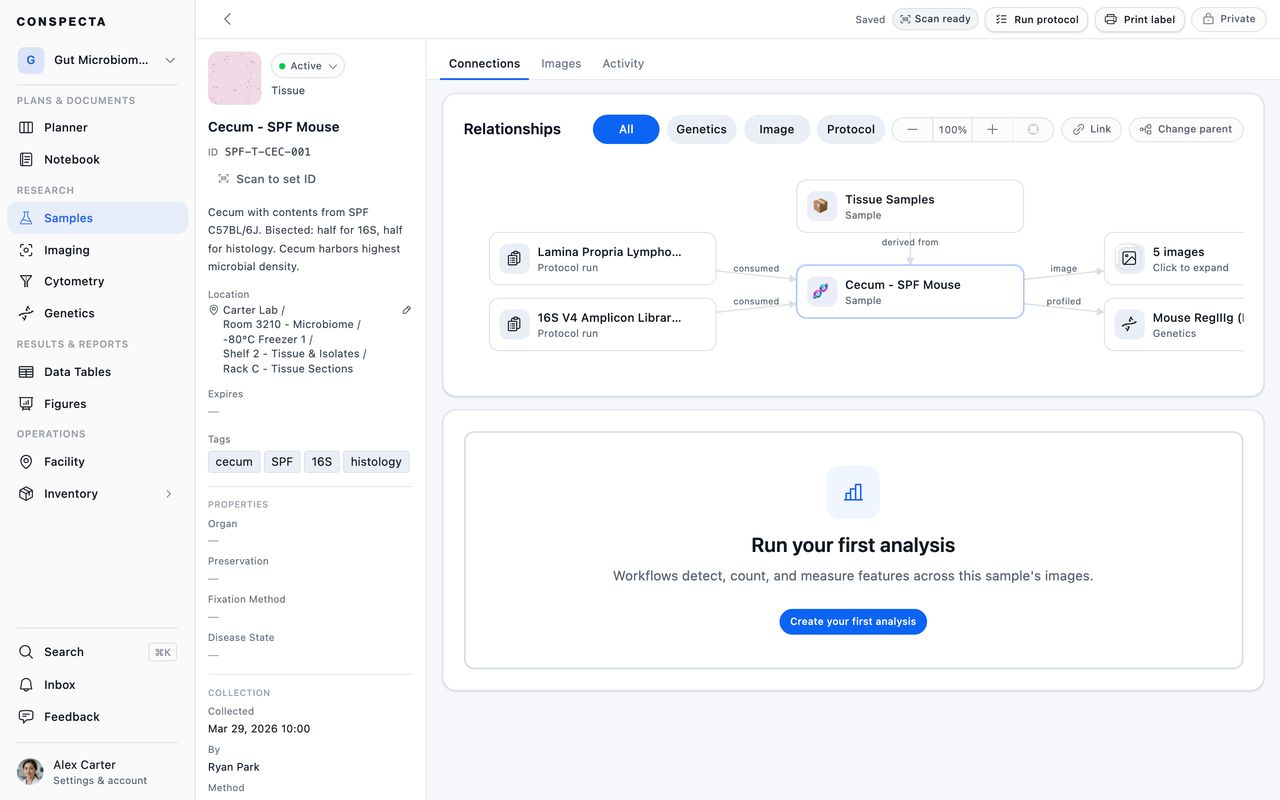
Open any sample and its Connections tab draws the map: what it came from, and everything downstream of it. Photos, image analysis, cytometry, FCS files, data tables, figures, protocol runs, notebook pages, inventory, orders, and tasks all appear as nodes you can click through, and clicking one re-centers the map on it. Filter above the map narrows it to one kind of record, with All to put them back. The zoom control sits in the bottom right of the map itself.
Set parent sample records lineage, so a subclone points at the culture it came from and a section points at the block. It is the dashed box directly above the sample on the map, where the parent will appear once you pick one. After that, the box is the parent, and Change parent sample sits in its … menu.
To go the other way and name what came out of the sample you're on, use Link and pick the sub-sample. Two samples can only be related by one coming from the other, so it asks which of them came first and draws that on the map.
Other workspaces show the same relationships from their own side:
- A figure's sidebar lists the analysis work that contributed its panels.
- A collection's header has a Connections menu holding the runs built from it, the notes that reference it, the sample its images came from, and the figures they ended up in, with View as graph for the same map.
- A data table shows which figures were built from it.
- A protocol run lists the samples it consumed and the samples it made.
Linking Things Yourself
Where the chain doesn't make the link for you, you can:
- Embed a resource in a note, protocol, or task. The
/menu inserts a live reference to a sample, sequence, data table, image collection, cytometry analysis, order, supplier, task, protocol, or run. - Link anything from the Connections map. The map's Link button joins whatever the map is centered on to anything else in the project you can find by search, such as an analysis, a figure, a task, or a protocol run. To build a chain of links, use Link from here on a node. It re-centers the map on that node and starts a link from it, so you can join a run, the sample it produced, and that sample's sequence in one sitting.
- Embed data into a table, which pulls a whole workspace in as rows that refresh from their source.
- Link a session to what it produced, on an instrument's Sessions tab, from the files acquired during that booking.
- Attach a step to a material or instrument when writing a protocol, so running it draws down that material's stock and links the run to that instrument.
Live, Snapshot, or Manual
Some links update on their own, and some hold what they had when you made them.
| Link | Behavior | Why |
|---|---|---|
| Embedded columns in a data table | Live, refreshed on demand | The source workspace holds the values, and you pull the latest when you want it |
| Image analysis results | Written to a data table as each run completes | Each run replaces the table's numbers with its own |
| Flow statistics sent to a table | A snapshot, taken when you send it | A figure built on those numbers keeps them when someone moves a gate |
| A chart panel in a figure | Linked, and refreshed only when you choose | A figure keeps the numbers it was made with, flags a panel whose source has changed, and offers to refresh |
| A protocol run's recipe | Frozen when the run starts | The run records the steps you followed, even if someone edits the protocol mid-run |
| An approval or sign-off | Goes stale when the content changes | An approval covers the version that was signed |
What You Can Do With the Connections
Tracing a result backwards. Given a number in a figure, you can reach the table, the analysis, the images, and the sample.
Moving work without breaking it. Moving an image analysis to another project brings its images and tables, moving a figure brings the images in its panels, and moving a sample brings its photos. Anything you had already deleted stays behind in the original project's Trash, where you can still restore it.
Knowing what an item touched. A reagent lot shows the runs that consumed it. An instrument booking shows the files acquired during it. A protocol shows every run of it, and each run shows what it produced.
Asking questions in plain language. An AI assistant connected to your lab can follow these links. You can ask it "Which samples used lot 4471, and what did the analysis show?" See Connect your AI assistant.
Tip: Start work from the record it's about. Running an analysis from the sample, or a protocol from the sample group, takes the same clicks as starting from the workspace and records where the work came from.
Where Links Don't Reach
A private item is invisible to everyone but its owner, everywhere, including in someone else's connection map. If a teammate can't see a link you expect, check whether the thing on the other end is still private.
A picture takes the privacy of whatever it is attached to. Photos and attachments have no sharing setting of their own, so one added to a private note or specimen is as private as that note or specimen, filename included. Share the note and the picture travels with it. Pictures of your freezers and shelves are the exception: storage is shared across the lab, so their photos are too.
Files you keep outside Conspecta aren't part of the graph. A result computed elsewhere and pasted in as an image is stored as a picture, with no link to where it came from. If the provenance matters, bring the numbers in as a data table.