Data Tables
Data Tables is the spreadsheet inside Conspecta, where your project's numbers are kept. Type them in, import them, or pull them from your samples and inventory, then summarize, fit, and chart them, and add the result to a figure.
Every image analysis run and every set of flow statistics you send onward also becomes a table here.
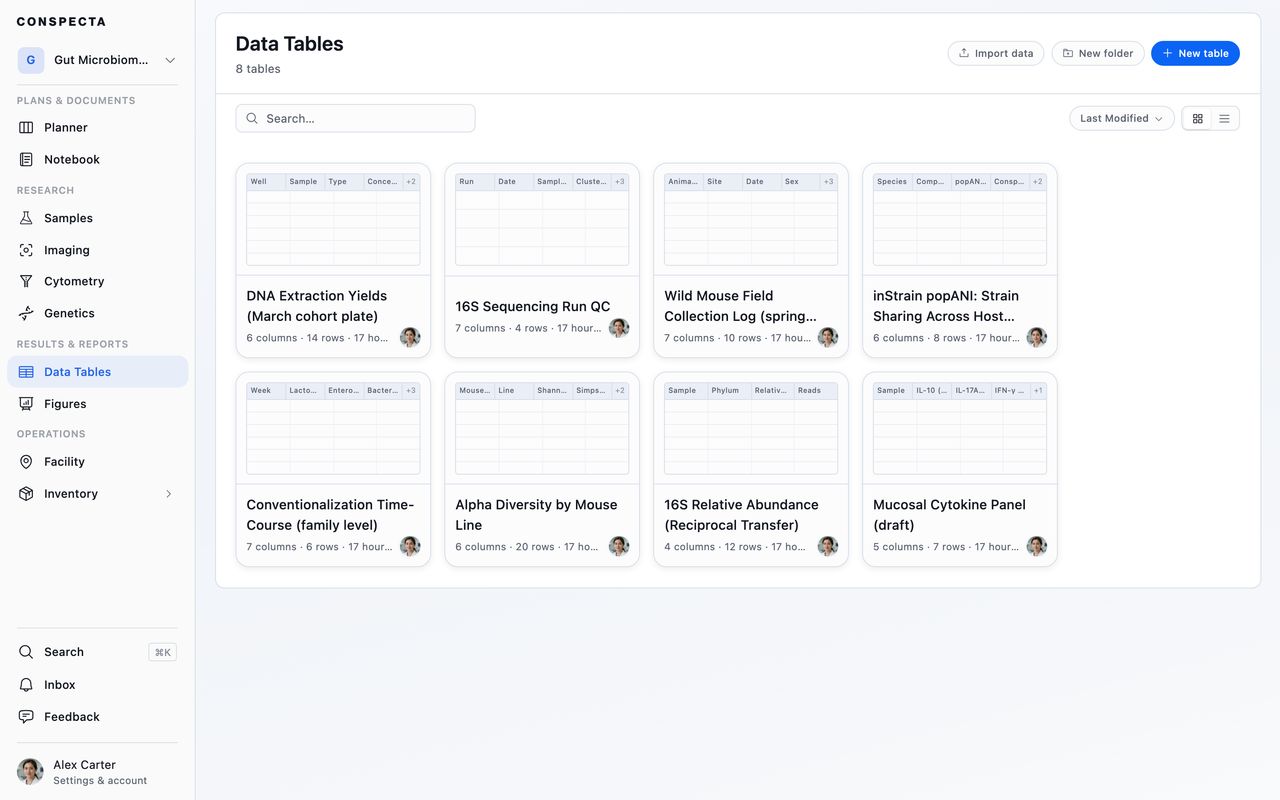
Creating a Table
New table opens a picker with a blank table, ten starters, any templates your team has saved, and a tile for importing a file. Choose one, decide whether the table is private to you or shared with the project, and give it a name. Nothing is saved until you've named it.
Saving a table as a template puts it in the same library as your notes and protocols, which is capped at 200 of your own and 500 shared with the team. See Templates.
Each starter is an empty table with the columns the job needs:
| Starter | Columns |
|---|---|
| Dose-response | Concentration (µM), Response A, B, C |
| Timecourse | Time (h), Condition, Measurement |
| Sample measurements | Sample, Replicate, Value, Units, Notes |
| Buffer recipe | Component, Stock, Final concentration, Volume |
| qPCR results | Sample, Target, Replicate, Cq |
| Standard curve | Standard, Known concentration, Reading 1, Reading 2 |
| Plate readings | Well, Sample, Condition, Reading |
| Cell counts | Date, Sample, Live cells, Dead cells, Viability (%) |
| Band quantification | Lane, Sample, Target signal, Loading control, Normalized |
| Experiment conditions | Condition, Variable, Level, Replicates, Notes |
You can also paste a range into the grid, and the table grows to fit it.
A table a protocol run made for one of its steps names the run in its header, and clicking it opens the run. A table made on a note, from its picker or with Turn into data table, names that note in its header. Click it to open the note. Someone who can't open the note doesn't see it named.
In a table a protocol run made, a column that records a field from your team's data dictionary keeps that field's choices and expected range, the same as a column you give a field yourself.
Importing
Import, under the ⋯ in the header, takes CSV, TSV, XLSX, and XLS, one table per file, named from the filename. New table's picker offers the same thing as an Import a file tile, and tables imported that way are private or shared to match the picker's choice. An empty workspace also takes a drag onto the page.
Spreadsheet formulas come across with the import. A table that arrived with formulas shows a banner explaining what happened to them, because Conspecta recomputes only the functions listed under Formulas and keeps the rest as written.
Canceling an import partway deletes the half-written table.
Microbiome Tables
Import also takes microbiome tables: BIOM (.biom) and QIIME2 visualizations (.qzv). Both arrive with a column per taxon and a row per sample, and the sample IDs run down the left of the table as row labels, where charts and sample linking can use them. A QIIME2 taxa bar plot comes in at the most detailed level the file carries.
A table holds up to 512 columns. A raw feature-level BIOM file is usually much wider, so the import refuses it and names its column count. Collapse it to a higher taxonomic level and import again.
Adding Rows From a File
Add rows from a file, in an open table's ⋯ menu, appends a file of readings, such as a plate reader's export, to the bottom of that table instead of making a new one. It takes the same file types, plus the tab- or comma-separated .txt files many instruments save.
The file's columns are matched to the table's by name, and you can change any match or skip a column. Derived and linked columns fill themselves and take nothing from the file. The rows already in the table stay as they are, and the table's activity records the new rows like any others.
Filling Readings From a Plate Reader
Fill readings from a file takes a plate reader's grid export and puts each well's reading on the row whose Well cell names that well. The export is laid out like the plate, with 1 to 12 across the top and A to H down the side (A to P and 1 to 24 for a 384-well plate). The table needs a column headed Well. A grid you drop into Add rows from a file on such a table opens it too.
The dialog shows the file as the plate, with a ring on each well the table has a row for.
- Pick the column under Put values in.
- When the file holds several reads, such as two wavelengths, each gets its own column or Skip.
- A cell that already has a value is left as it is and counted.
- Wells the table has no row for are skipped unless you tick Also add rows for the wells this table doesn't have, which is ticked from the start when the Well column is still empty.
Finding a Table
The search box matches part of a table or folder name, or a table's description, as you type, across the folder you have open and everything inside it. View on the toolbar holds sorting and filtering. Its Filter section narrows what's left, and the choices combine:
| Filter | What it holds |
|---|---|
| Status | Draft, In progress, Ready, Archived |
| Source | Linked for a table that refreshes from a project resource, Snapshot for a one time copy of a run, Typed or imported for everything else |
| Created by | One person on the project. It appears once two people have made a table here |
| Review | Review requested, Changes requested, Approved, Rejected, No review |
Folders stay visible whichever filter you pick, because the table you're after may be inside one. Switching to the list view adds a Status column, so you can read where every table stands without opening any of them.
Large projects show a Load more at the bottom.
Review Status
Once any table in the list has been signed off or sent for review, the list adds a Review column. It spells the status out, reading Review requested, Changes requested, Rejected, Approved, or Approved · edited since.
A card and the editor's toolbar each carry the same thing as a small colored mark:
| Mark | On a card | In the editor's toolbar |
|---|---|---|
| Green | Approved | Signed off |
| Amber | A review still owed, changes requested or an edit since | A review still owed, changes requested or a table edited since it was signed |
| Red | Rejected | Rejected |
Hover a card's mark to read the status and who approved it, rejected it or asked for changes. Hover the toolbar's mark to read it in words, or click it to open Activity.
Moving a Table
Tick a table's row and the bar carries Move, which offers this project's folders and, below them, the other projects you can edit. A table you have open moves as well, through Move to… in its three dot menu, which returns you to the list once the table has gone.
Either way the table takes its rows with it, and the pictures on them arrive in the new project too. A table carrying more than a thousand pictures brings the first thousand, and a message says the rest stayed in the old project, where deleting that project would remove them. See Moving work between projects.
Folder and Table Menus
A folder carries a three dot menu of its own, on its card and on its row in the list, holding Rename, Move to..., Star, Download, Share or Make private, and Delete. Some of these act on everything the folder holds:
- Download opens the export dialog box on that folder and everything in it.
- Share and Make private change the tables inside the folder. They appear only on a folder whose tables you made, because only a table's creator can change its sharing. In a large project both can show, and either one covers every table in the folder.
- Delete trashes the folder along with everything inside it, and the confirmation lists every table that goes with it.
In the list, each table's row carries a three dot menu too, with Rename, Move to..., Star, Download, Share or Make private, Duplicate table, Save as template, and Delete, each acting on that one table.
Duplicating a Table
Duplicate table in a table's three dot menu, in the list or at the right of the toolbar inside an open table, makes a copy in the same folder and opens it. The copy is named <name> (Copy), and a second copy of the same table becomes (Copy) (1).
It keeps every row, the columns and their formatting, the description, the charts, and the original's sharing. The pictures on its rows are copied with it and count toward the project's storage, and a table carrying more than 200 pictures is too large to duplicate.
A linked column stays linked in the copy and refreshes on its own, from the same source as the original. A copy of a results table written by an image analysis or a cytometry analysis is an ordinary table that you can edit, and its toolbar reads Snapshot from the table it came from.
The copy starts its own history. It belongs to you and reads as Draft, with no published versions or sign-offs. Its activity opens with a line naming the table it was duplicated from, and the original's activity gains a line naming the copy. Duplicating needs edit access to the project.
The Grid
Everything saves as you type, and the status bar shows whether your changes have saved. When a save doesn't go through, it reads Not saved with a Retry button, and it tries again by itself once the connection or the server is back.
Signing off, asking for a review, moving the table to another project and duplicating it save your latest change first. If that change can't be saved, while you're offline for example, the action doesn't happen and a message says the table couldn't be saved.
Under the grid you also see the row count, how many distinct values your grouping columns hold (something like "Sample: 4 distinct · Phylum: 3 distinct"), and what's currently selected.
Columns come in three kinds, and the header color shows which:
- Raw columns are yours, typed or imported, and fully editable.
- Derived columns were produced by an Analyze action. Their cells are read-only and recompute when the values they depend on change.
- Linked columns come from elsewhere in the project, refresh from their source, and can't be edited here. An amber dot means the source has changed and a refresh is available.
Each column's menu handles renaming, sorting, filtering, formatting, width, freezing, inserting, duplicating, and deleting. Sorting and filtering are view-only. They change what you see and leave the stored table as it is, and the footer carries a note saying so.
Exclude from analysis in a row's menu takes an outlier out of the analysis without deleting it. Give a reason, and the row stays in the table, dimmed, with a mark whose tooltip gives the reason. Include again in the same menu brings the row back.
Charts of the table, in the drawer, on a note, or in a figure, leave the row out, and so do the fitted curves of dose-response and ELISA tables. A chart on a note says how many rows it skipped. Formulas still read every row.
Format changes how a number is displayed and leaves the stored value as it is. Each choice shows a sample of how a value would read, such as 85% for Percent, and Custom… sets your own decimals and unit. Sorting, charts, and exports still read the stored value. Date styles are fixed for every viewer, so a collaborator in another country reads the same column you do.
Using a Field From the Data Dictionary
Data dictionary field…, below Format in a column's menu, gives the column one of the fields in your team's Data dictionary. The list shows each field's type with its unit and range, or its choices. The column keeps its own name, and hovering its header names the field.
What the column takes from the field:
- Choices become a dropdown while you type, and anything else you type still saves.
- A range marks a number outside it with an amber fill and a corner mark. Hovering the cell says what is off and where the expectation comes from, such as Outside 10 to 500, the range the data dictionary sets for Concentration, or Not one of the choices the data dictionary lists for Gel result. A table a protocol run made can carry a range or choices from the protocol itself, and its cells say so the same way. The value stays as you typed it.
- A unit shows after every number. Format shows it read-only and keeps it, offering plain, decimals and scientific for that column.
While a column uses a field, that menu entry reads Field: and its name, and opens Pick another field… and Unlink from data dictionary, which removes the field from the column and keeps every value and the unit. A table saved as a template keeps its columns' fields, and a new table made from it has them too. Data dictionary, in the ⋯ menu at the top of the workspace, opens the dictionary to read it, or to add a field for a column to use.
Formulas
Cells take Excel-style formulas. Start with = and the cell computes. Everything that reads a cell (sorting, filtering, charts, exports, copy and paste) reads the computed value.
Selecting a formula cell brings up a formula bar, which is where you edit it. Esc reverts. While you write a formula, in the cell or in the formula bar, each cell or range it reads in this table is outlined in its own color.
Reading Another Table
A formula can read another table in the project. Write the table's name in square brackets before the cell or range, as in =B2/AVERAGE([Plate 1 raw]!B2:B13), or pick it from Reference another table in the formula bar, which writes the name at the cursor.
The cell shows the answer from the other table's current rows, and when that table changes, the formulas reading it follow, while this table is open or the next time it opens.
Renaming the other table keeps the formula working under its new name. Once it is deleted, the cell shows #REF!, and deleting it first warns that another table uses it. Connections in the table's ⋯ menu lists the tables it reads and the tables that read it.
Supported Functions
The supported functions are: IF, AND, OR, NOT, IFERROR, ABS, ROUND, ROUNDUP, ROUNDDOWN, SQRT, POWER, EXP, LN, LOG, LOG10, MOD, SUM, SUMIF, AVERAGE, MEDIAN, MIN, MAX, COUNT, COUNTA, STDEV, ISBLANK, CONCAT, CONCATENATE, LEFT, RIGHT, MID, LEN, TRIM, UPPER, LOWER, and TEXT.
Functions whose answer changes on its own are left out:
NOW, TODAY, RAND, INDIRECT, OFFSET and their kind, because two
people opening the same shared table would compute different numbers. An
imported formula using one of them is kept as written and shows the value
it came in with.
Analyze
Analyze runs a named operation over the table. Pick one, fill in which columns it should use, and press Run. The result appends derived columns, a result card, or both, in a single step you can undo.
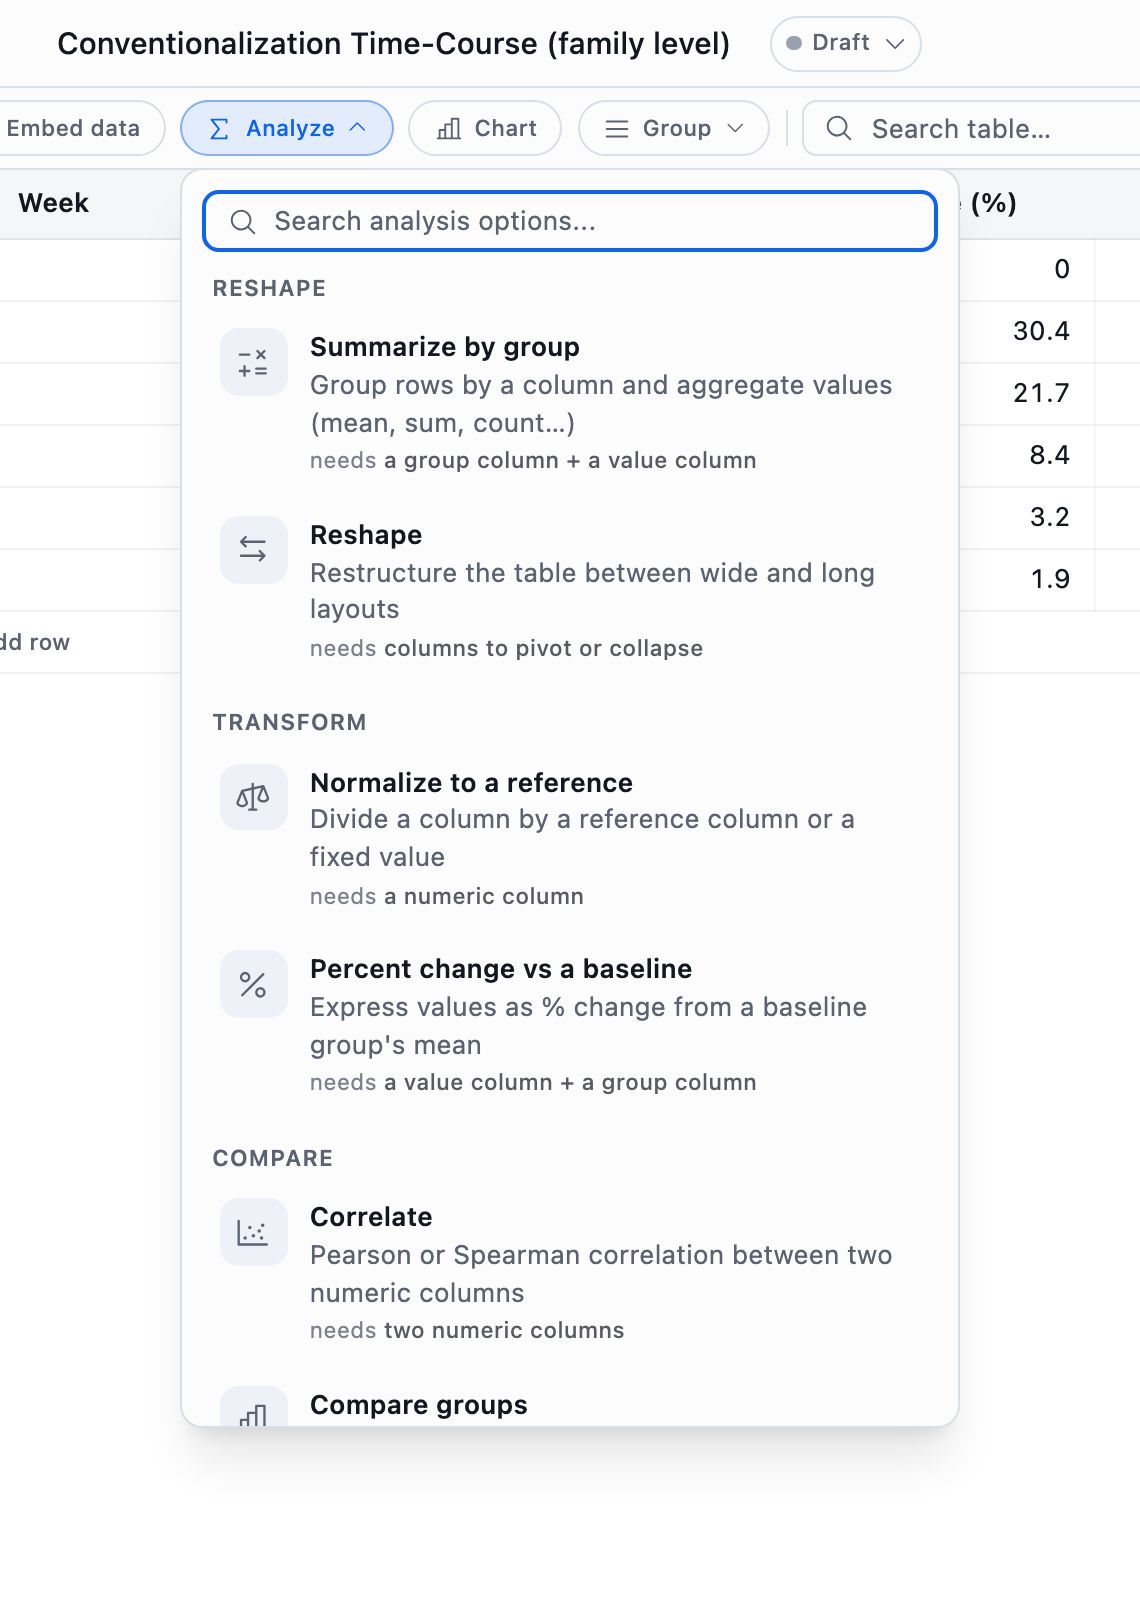
| Group | Action | What it does |
|---|---|---|
| Reshape | Summarize by group | Groups rows by a column and aggregates the rest by mean, sum, count, minimum, maximum, or standard deviation |
| Reshape | Reshape | Moves between wide and long layouts |
| Transform | Normalize to a reference | Divides a column by another column or a fixed value |
| Transform | Percent change vs a baseline | Expresses values as a percentage change from a baseline group's mean |
| Compare | Correlate | Pearson or Spearman correlation between two columns, with r, r², and n |
| Compare | Compare groups | A t-test or ANOVA of one column across groups, with per-group means and significance |
Results that aren't columns appear as cards in the Results panel and are saved with the table.
Assays
Three guided fits sit in the same menu, under Assays:
- qPCR ΔΔCt normalizes target Ct values to housekeeping genes and a calibrator group, producing ΔCt, ΔΔCt, and fold-change columns
- ELISA standard curve (4PL) fits a standard curve from your knowns and interpolates the unknowns into a concentration column
- Dose-response IC50/EC50 (4PL) fits a dose-response curve and reports the IC50 or EC50
A table can also be created as a qPCR assay, in which case it opens on a short setup that maps your columns and previews the ΔΔCt calculation before you commit.
After an ELISA standard curve or a dose-response fit, Chart opens on a scatter of the known concentration (or dose) against the signal (or response), with the fitted curve drawn over the points. Pick a different chart and the table opens on yours from then on.
Charting
Chart opens a panel under the grid. It has four controls: chart type, the x axis, which columns are values, and what to group by. Leave any of them empty for a sensible default.
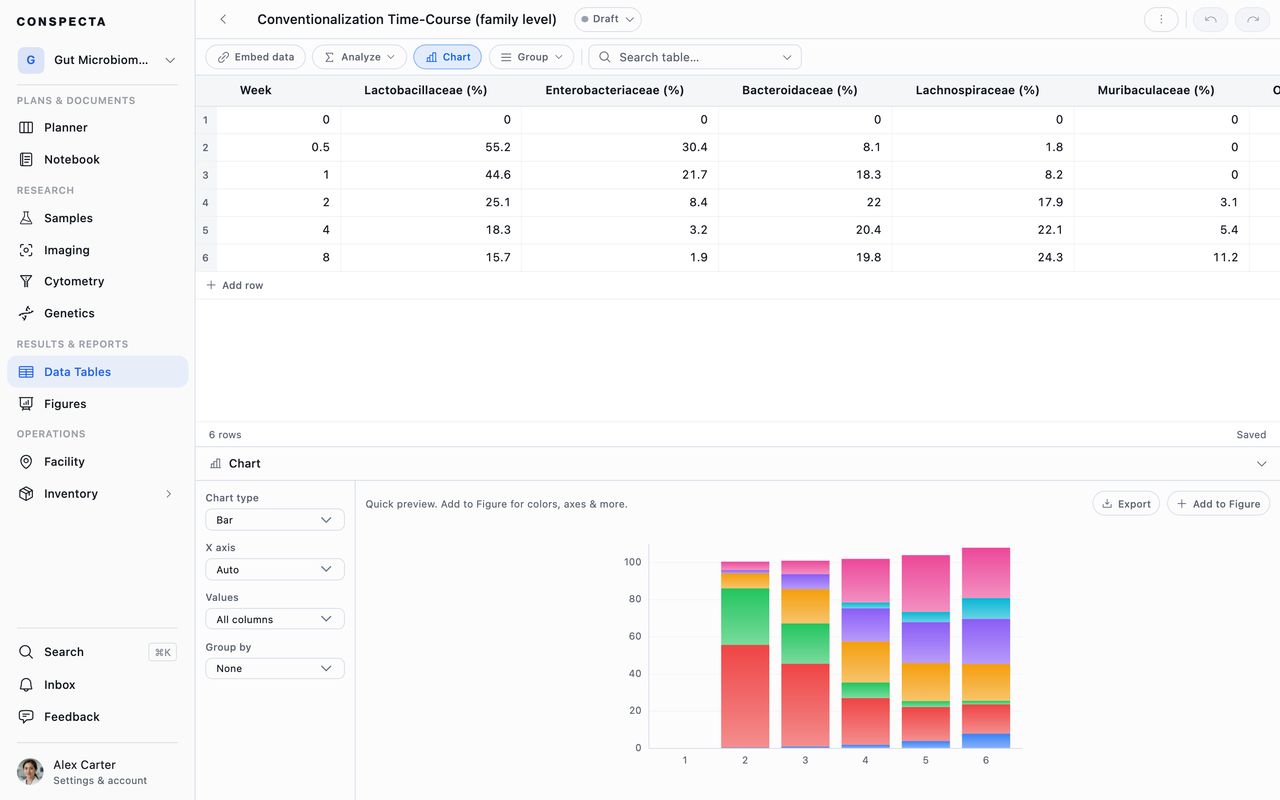
The panel is a quick preview. When it looks right, Add to Figure promotes it into an existing figure or a new one, where the full styling controls are. That editor has its own page, Customize a Chart.
Export takes the preview itself as PNG, SVG, TIFF, or PDF at a printed width in millimeters and up to 600 DPI, or copies it to the clipboard. The SVG is a vector file, so bars, points and axis ticks each select on their own and the legend stays editable text.
Theme draws it Light or Dark, and starts on Light whichever theme the app is in.
A column beside the chart lists every figure already built from this table, each one a link. Build Figures covers laying one out.
On a phone held upright, tap the line naming what's charted to open the four controls.
Embedding Live Data
Embed data pulls a project resource in as columns that refresh from their source. It adds a row per item and leaves your own columns and rows alone.
Two kinds of source:
- Live resources bring in a whole workspace at once, one row each: Samples, Inventory, Orders, Tasks, Locations, Genetics, and Image analysis. Sample status and health, stock quantities, order totals, and task deadlines all refresh from the workspace that owns them.
- Assays and plates bring in one specific thing you pick: a Plate, with a row per well, a Sample set, with a row per member, one or more Analysis runs, with their per-image results, or a protocol's results. Pick several runs and a Group column names each row's source, so treated and control land side by side ready to chart.
Protocol results brings in one result table from every run of a protocol, or each run's captured values with a row per run. Each row starts with its run, the day it started, who started it, the protocol version and the run's status. It pulls from run tables shared with the project, and a row excluded in its run's table arrives excluded with the same reason. Refresh after another run finishes to add its rows.
A linked table fills once. Add your own columns beside the pulled ones, annotate rows, and refresh when you want the latest. If an upstream record is deleted, its row keeps the values you last pulled and your notes, with a flag showing the source is gone.
Finding Things
Search table filters rows to those matching in any column, and a caret in the search field opens find and replace. Group by folds rows into groups by a column's value. Freeze up to here on a column keeps the identifying columns on screen while you scroll right.
Cmd/Ctrl + Z and Cmd/Ctrl + Shift + Z undo and redo grid edits.
Sharing and Collaboration
A table is private to you or shared with the project, chosen when you create it and changeable later. A results table written by an image analysis or a cytometry analysis is the exception: it takes that analysis's sharing and follows it whenever the analysis changes.
A shared table in a team project supports live co-editing, so everyone on the project can work in the same grid, with presence avatars in the toolbar showing who's in it. Very large tables (past about 50,000 cells) turn live editing off.
Without live editing, two people can still work in one table. When a teammate saved it after you opened it, your save takes their changes in:
- Edits to different cells both stay.
- Rows either of you added at the bottom are kept.
- If you both changed the same cell, or one of you deleted a row the other changed, a box above the grid shows Some fields were updated by another user. with each version under Keep mine and Use theirs, named by place, such as Row 3, Concentration. Nothing else you change saves until you choose and click Apply.
- Changing the columns while someone else edits rows asks about the whole table.
The same box asks when you and a teammate both renamed a table or changed its status, whether or not it is live.
Project members with view-only access can read and export any table but can't change it.
Tables carry a status from Draft through to Ready or Archived, and an Activity panel with comments and sign-offs.
Exporting
Export as Excel keeps formulas, number types, and formatting. Export as CSV writes values only, plus an Excluded column holding the reason for any row left out of analysis. Both export the table as it currently stands, including your latest edits and the values you last refreshed.
Those two write one open table. To take several at once, use Export in the workspace header or, once you tick rows, Download on the bar along the bottom. Both open the same dialog box.
What comes first, and it decides the rest of the dialog box:
- The tables themselves writes the same Excel or CSV files the two menu items above write, one per table, several arriving as a zip. A selection larger than 50,000 cells is refused before anything downloads, with the count named, so pick fewer tables and run it again.
- A list of them writes one row per table, carrying its name, folder, status, source, sharing, its column and row counts, and who made it when. This adds Columns, which starts with every column included and opens with Choose, and a Format of CSV or Excel.
Scope applies to both:
- The folder you have open
- That folder and everything inside it
- The whole workspace
- The rows you ticked, which is what Download opens on
In a folder that holds no folders of its own, the first two are one choice, This folder, since both would cover the same tables. A ticked folder stands for the tables inside it.
Download on a folder's own three dot menu asks only about that folder and everything in it, or the whole workspace, whatever level the list is showing. On a table's row it asks only about that table, or the whole workspace.
Every scope carries the search box and the facets you have on screen, so filtering to one source and pressing Export covers only those tables.