The spreadsheet your whole lab shares



The spreadsheet your results go into.
Scientists reach for a spreadsheet because it bends to any experiment. You set the layout and the rules, and every value stays in plain sight. Sheets keeps the familiar cells, formulas, and fill, and connects them to the rest of your project.
Here a row can point at a real sample, and you can send gated statistics from a flow run straight into a sheet. From there you can turn the sheet into a chart panel in a figure, so the figure you publish is drawn from the numbers you computed.
The whole lab works in the same sheet at once, with an avatar for each person who has it open.
Video walkthrough
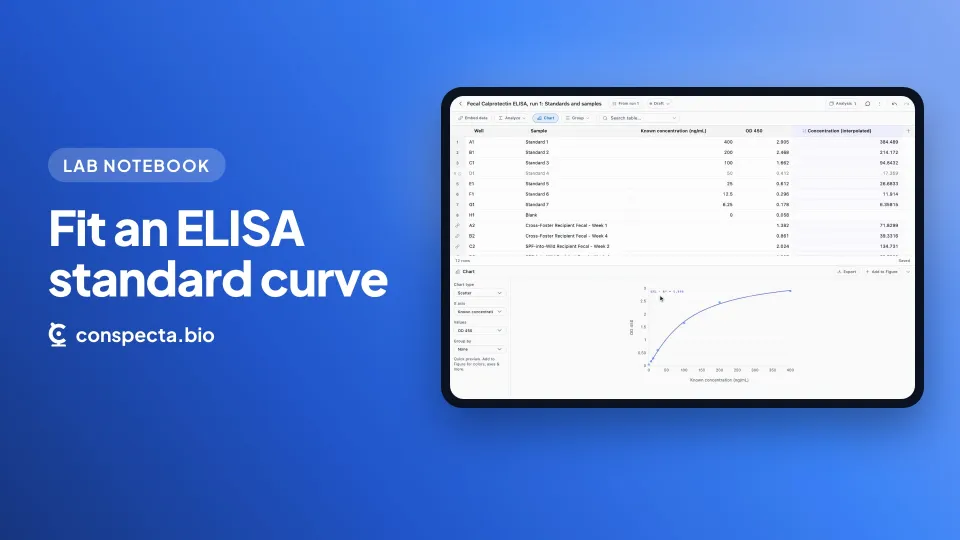
Run the qPCR and ELISA math on the sheet itself
The Analyze menu has three guided fits, for qPCR ΔΔCt, an ELISA standard curve, and a dose-response IC50. ΔΔCt normalizes target Ct values to your housekeeping genes and a calibrator group, writing ΔCt, ΔΔCt, and fold-change columns. The two 4PL fits interpolate unknown concentrations and report the potency. An assay sheet draws its fitted curve over a scatter of the same data, so the fit and the points it came from are one picture.
Compare groups without leaving the sheet
Analyze runs a named operation over the rows. Summarize by group, reshape between wide and long, normalize to a reference, express a percent change against a baseline, correlate two columns with Pearson or Spearman, or compare groups with a t-test or ANOVA. Pick one, fill in which columns it should use, and press Run. Derived columns appear beside your data and recompute when it changes, and a result that isn't a column is saved with the sheet as a card.
Pull a whole workspace in as rows, and keep it current
Embed data pulls Samples, Inventory, Orders, Tasks, Locations, Genetics, or image analysis in as columns that refresh from their source, one row per item. Or point at one thing. A plate becomes a row per well, a sample set a row per member, and several analysis runs share one sheet, with a Group column naming each row's source. Your own columns sit beside the pulled ones, and a record deleted upstream keeps its row with the values you last pulled, flagged so you can see the source has gone.
Chart it here, publish it in a figure
The Chart drawer under the sheet takes four settings. Pick the chart type, the x axis, which columns are values, and what to group by. A rail beside it lists every figure already built from this sheet, each one a link. Export the preview as PNG, SVG, or TIFF at a printed width in mm and up to 600 DPI, or send it to a figure where the full styling controls live.
More in the Sheets workspace
Working in the sheet
Columns you type, compute, or link
Raw columns you type, derived columns an Analyze action recomputes, and linked columns that refresh from their source.
Familiar formulas
SUM through STDEV, IF through IFERROR, LEFT through TEXT. Each one returns the same answer for everyone who opens the sheet, so a shared sheet stays reproducible.
Search, group by, and freeze
Filter rows by anything in any column, open find and replace from the search field, fold rows into groups, and freeze the identifying columns while you scroll right.
Sorting and filtering stay a view
They change what you see while what's stored holds still, and the footer says so.
Number formats everyone reads alike
Plain, fixed decimals, percent, scientific, or a date style, applied to the display while sorting, charts, and exports keep reading the underlying value.
Getting data in
CSV, Excel, BIOM, and QIIME2
Import CSV, TSV, XLSX, and XLS, plus BIOM files and QIIME2 visualizations with a column per taxon and the sample IDs down the left. Up to 512 columns a sheet.
Starter sheets for common assays
Dose-response, timecourse, qPCR results, standard curve, plate readings, cell counts, band quantification and more, seeded with the columns the job needs.
Sheets from image analysis and flow runs
Every image analysis run writes a sheet here, and so does every set of flow statistics you send on, ready to summarize and chart.
Sharing and export
Live co-editing
The whole lab works in the same sheet at once, with an avatar for each person who has it open. Past about 50,000 cells a sheet stays fully editable one person at a time.
Excel export keeps the formulas
Export as Excel is lossless, so formulas, number types, and formatting all survive. Export as CSV writes the values.
Status, comments, and sign-off
Draft through Approved or Archived, with the conversation and the approvals in an Activity panel.
Private or shared, your call
Choose at creation and change it later. Project members with view-only access can read and export any sheet.
Start your first sheet
Bring your data into a sheet linked to your samples and figures. Free for you and one collaborator.